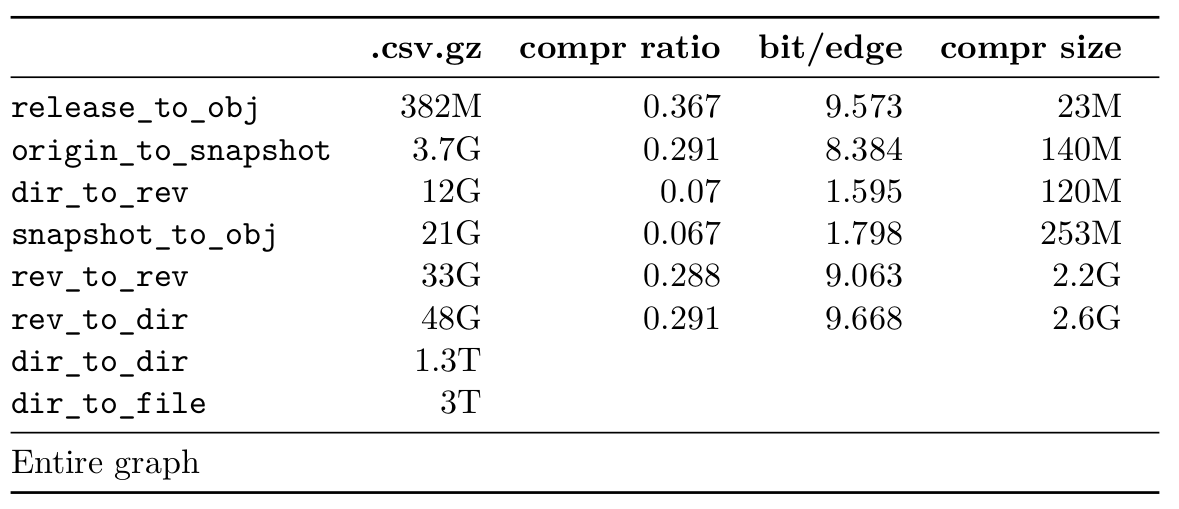
Now that everything is running, we can gather some data!
FROM maven:3.6.0-jdk-11
WORKDIR /app

# Download webgraph binary
RUN curl -O http://webgraph.di.unimi.it/webgraph-3.6.1-bin.tar.gz
RUN tar xvfz webgraph-3.6.1-bin.tar.gz
RUN cp webgraph-3.6.1/webgraph-3.6.1.jar .

# Download webgraph dependencies
RUN curl -O http://webgraph.di.unimi.it/webgraph-deps.tar.gz
RUN tar xvfz webgraph-deps.tar.gz

# Download LAW (for LLP ordering)
RUN curl -O http://law.di.unimi.it/software/download/law-2.5.1-bin.tar.gz
RUN tar xvfz law-2.5.1-bin.tar.gz
RUN cp law-2.5.1/law-2.5.1.jar .

# Monitoring
RUN apt-get update
RUN apt-get install -y time

WORKDIR /graph
COPY compress_graph .#!/bin/bash
DATASET=release_to_obj
setup_dataset() {
# Download the edge list
curl -O https://annex.softwareheritage.org/public/dataset/swh-graph-2019-01-28/edges/$DATASET.csv.gz
# Uncompress the edge list
gunzip $DATASET.csv.gz
mv $DATASET.csv $DATASET.edges
# Compute the node list
tr ' ' '\n' < $DATASET.edges | sort -u > $DATASET.nodes
}
java_cmd () {
/usr/bin/time -v java -Xmx256G -cp /app/'*' $*
}
mkdir -p bv bv_llp bv_sym
# Build a function (MPH) that maps node names to node numbers in lexicographic order (output: $DATASET.mph)
java_cmd it.unimi.dsi.sux4j.mph.GOVMinimalPerfectHashFunction $DATASET.mph /data/graph/$DATASET.nodes
# Build the graph in BVGraph format (output: $DATASET.{graph,offsets,properties})
java_cmd it.unimi.dsi.webgraph.ScatteredArcsASCIIGraph -f $DATASET.mph bv/$DATASET < /data/graph/$DATASET.edges
# Create a symmetrized version of the graph (output: $DATASET.{graph,offsets,properties})
java_cmd it.unimi.dsi.webgraph.Transform symmetrizeOffline bv/$DATASET bv_sym/$DATASET
# Find a better permutation through Layered LPA (output: $DATASET.llpa)
java_cmd it.unimi.dsi.law.graph.LayeredLabelPropagation bv_sym/$DATASET $DATASET.llpa
# Permute the graph accordingly (output: $DATASET.{graph,offsets,properties})
java_cmd it.unimi.dsi.webgraph.Transform mapOffline bv/$DATASET bv_llp/$DATASET $DATASET.llpa
# Compute graph statistics (output: $DATASET.{in*,out*,stats})
java_cmd it.unimi.dsi.webgraph.Stats -s bv/$DATASET
java_cmd it.unimi.dsi.webgraph.Stats -s bv_llp/$DATASET
java_cmd it.unimi.dsi.webgraph.Stats -s bv_sym/$DATASETTo build and run the docker container:
$ docker build -t dataset .
$ docker run --name dataset --volume /path/to/graph/:/data -ti dataset:latest bash
Where the /path/to/graph/ directory contains the edges
and nodes lists. The Docker volume enables you to easily access the
graph stored outside of the container itself.
As a reminder, the VM used had 2TB of RAM and 128 vCPUs. Also note that these results may vary because the LLP step uses random permutations.
Datasets are taken from here: https://annex.softwareheritage.org/public/dataset/graph-compression/swh-graph-2019-01-28/edges/
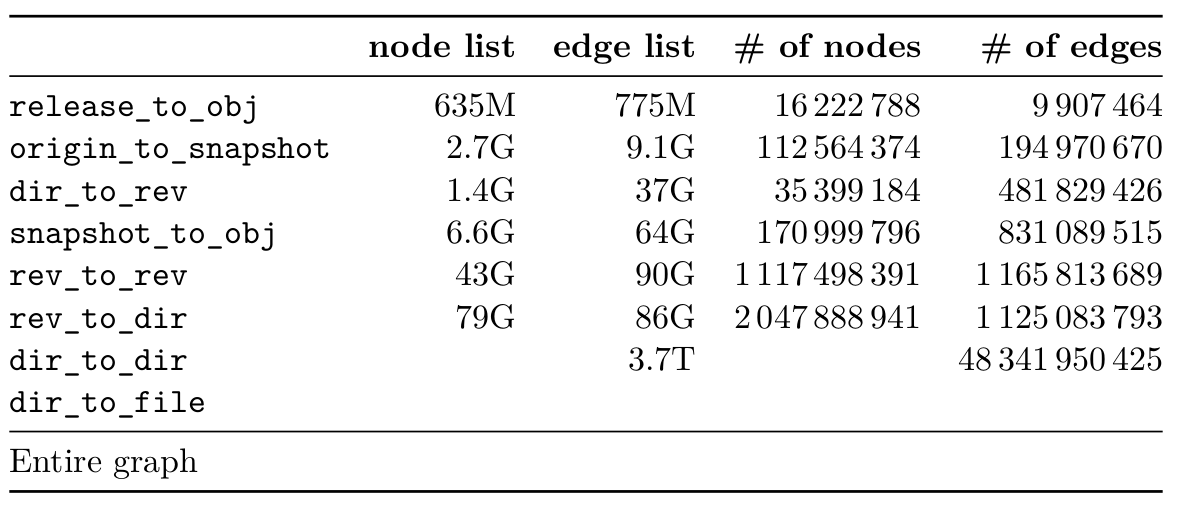
To count the nodes and edges, I used GNU Parallel tool:
$ parallel --pipepart -a dataset wc -l | awk '{s+=$1} END {print s}'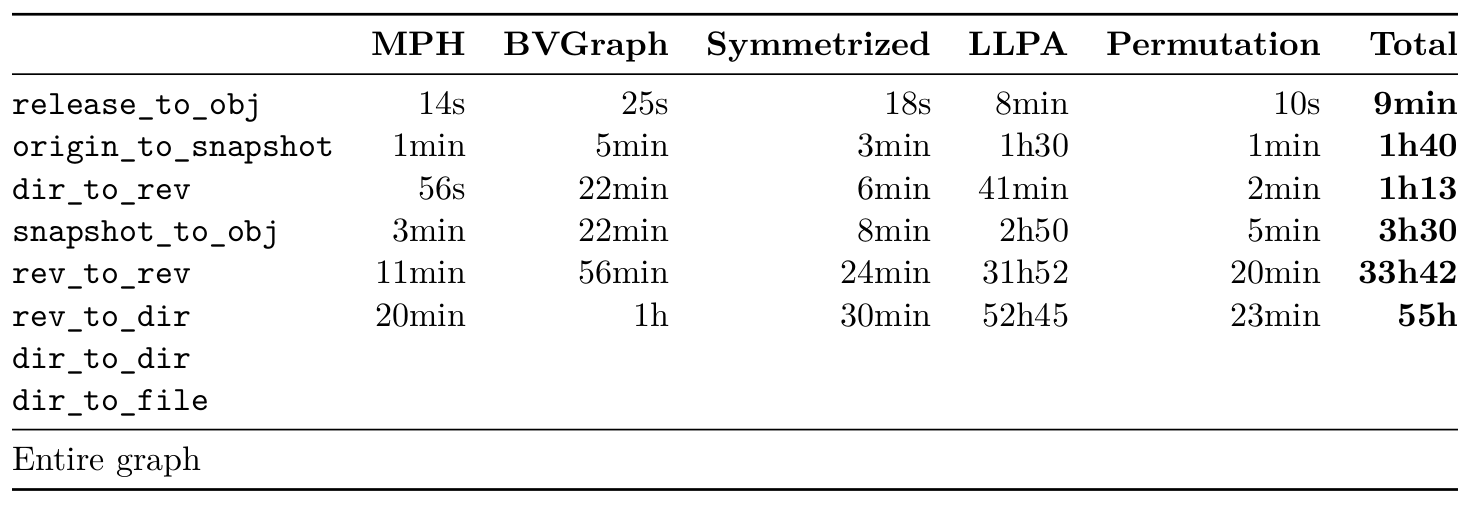
I also tried to get monitoring running for memory and CPU consumption. To monitor the Docker container, I chose cAdvisor, Grafana and Prometheus.
The cadvisor
documentation suggests to run this Prometheus
monitoring. One problem I could not fix was cadvisor metrics not
reading correctly the CPU stats (even with
--enable_load_reader=true). Even though the CPU consumption
is not the most interesting/relevant metric here, I tried and search for
solutions but ended up running out of time since the VM was only
available for two weeks, so I started the experiments anyway. To access
the Grafana dashboard you can setup SSH port forwarding:
$ ssh -L localhost:3000:localhost:3000 your_server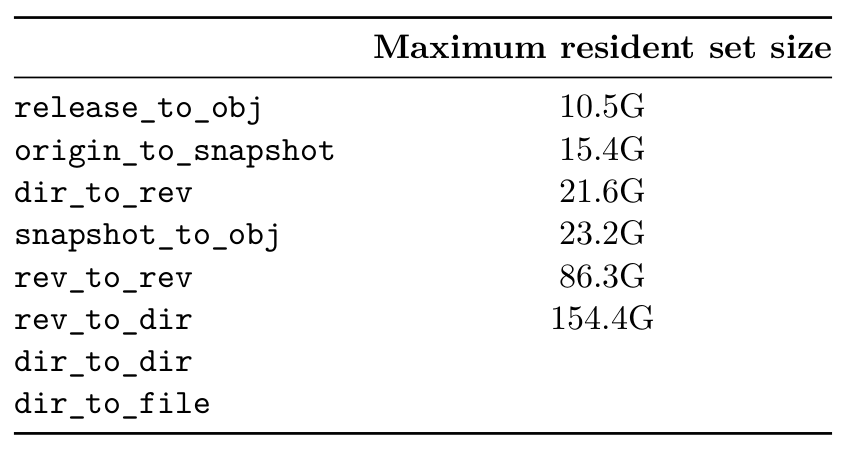
This table shows max memory usage (obtained with
time --verbose). The Docker monitoring memory graphs look
like this:
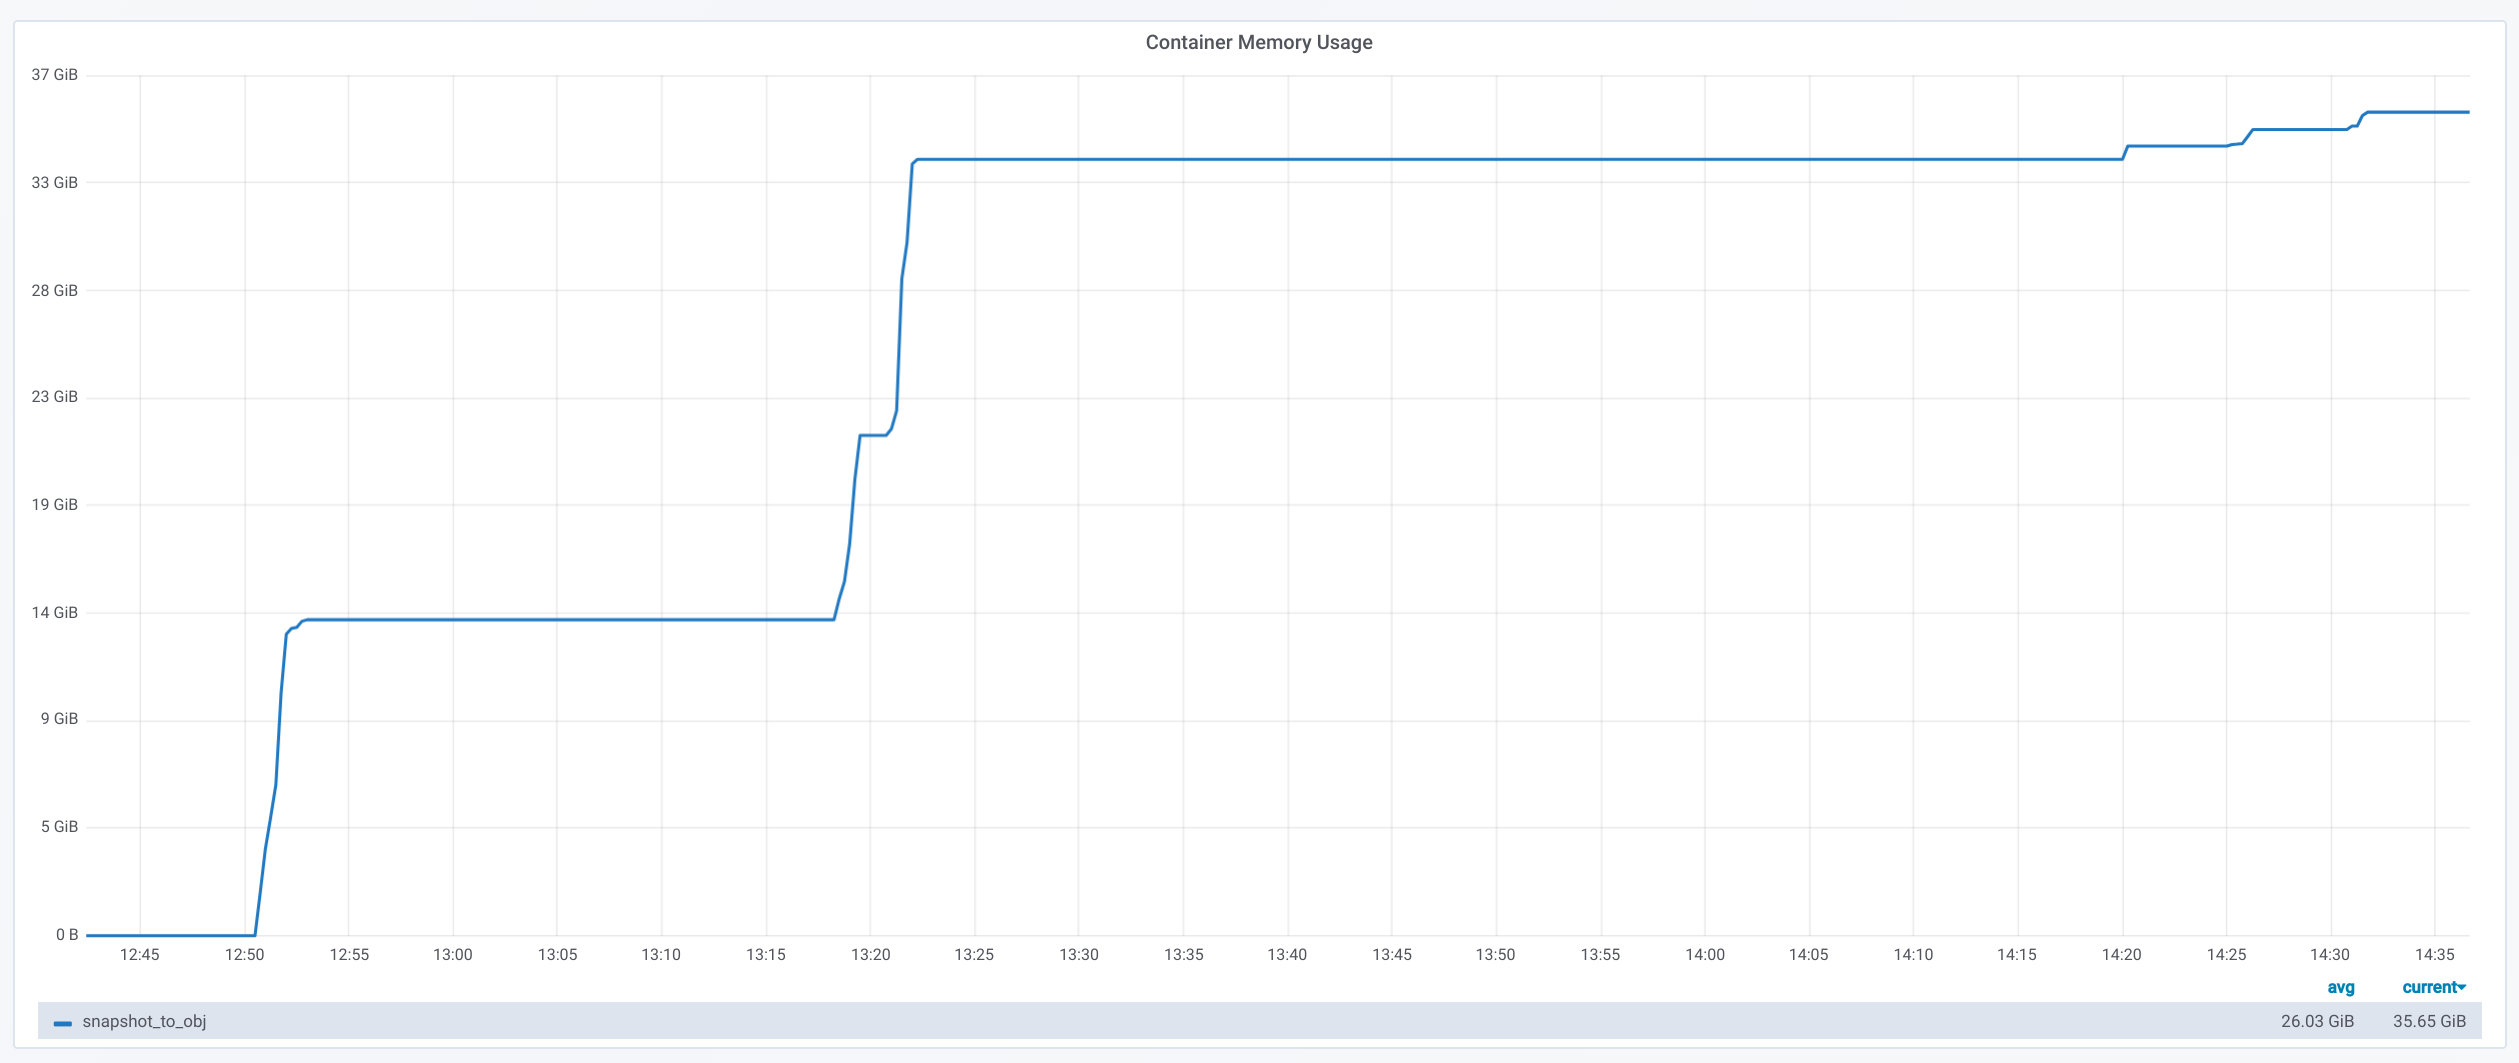
After all the time -v command seems to be more practical
since you can measure individual steps, and it is not affected by any
Docker container memory overhead.
These experiments took many tries before obtaining the final results. I was entirely new to WebGraph, Docker, Grafana/Prometheus monitoring (+ the cadvisor problem about reading CPU stats). I had to re-start from scratch multiple times the compression script because of the above reasons, but also the Java heap running out of space or even disk space being full!
Additionally, the overhead needed to download/uncompress the edge list and to create the node list prevented me to run any sort of experiments on the really huge datasets (terabytes files).
In the end, the results are still very interesting and give us first feedbacks on using the WebGraph framework!
After the two weeks, we needed to downscale the VM to 256GB of RAM and 64 vCPUs, and free up some disk space. We uploaded all the results at Software Heritage annex: https://annex.softwareheritage.org/public/dataset/graph-compression/output/. Moving all this data around took quite some time, and meant doing some cleaning up too.
During waiting time (experiments, transferring data, etc.) I kept digging into research papers, the Software Heritage infrastructure and the WebGraph framework.
I read through many research papers, but also looked into their citations and references. Reading scientific papers is quite new to me, so this is was rather slow process. I took hand written notes, and transcripted them for the most important papers.
Some interesting blog posts about how to read a scientific paper:
Reading the graph compression literature helped to have a better overall understanding of the multiple approaches and use cases. Most studies I found used too small datasets or were very specific to the graph properties, but two papers got my attention:
Getting to know the Software Heritage meant digging into their documentation, wiki, source code and published papers:
I took notes on the infrastructure itself and the new programming concepts I discovered along the way here.
From the timings of the experiments, the LLP step seemed to take too much time to scale up to the larger datasets. At first I thought this was because the process was single-threaded, but only the DFS initialization step at the start is, the rest is multi-threaded. One solution is to simply reduce the number of $\gamma$ values. Another possibility suggested by Sebastiano when dealing with very sparse graph, is to simply not use LLP. The DFS ordering will yield very similar compression ratio, in much less time (on the rev_to_rev dataset, the DFS takes 30min compared to 32 hours for the full LLP).
After all these experiments, and data transferred to the SWH annex, some cleaning up was necessary to correctly share the results with Sebastiano and Paolo (I also added graph statistics).
Each datasets directory contains:
bv/: graph compression with BVGraphbv_llp/: graph compression with BVGraph + LLPbv_sym/: graph compression with BVGraph
(symmetrized)A graph is stored as a .graph, .offsets,
and .properties files (with a .obl file to
load the graph faster). Statistics about the graph are stored in
.properties, .indegree,
.indegrees, .outdegree,
.outdegrees, and .stats files.
Now the goal is to run the WebGraph framework on the terabytes datasets (dir_to_dir and dir_to_file). Unfortunately, no VM was available at the time with enough disk space and cores to run experiments on these datasets.
I decided to start experimenting with the graph bisection implementation first since we already got some positive feedbacks on its results from the WebGraph authors. Experiments on Ligra+ framework will have to wait a bit.
I emailed the author of the reproducibility study to learn more about the input format needed and how to transfer our data representation to theirs. Joel was very helpful and enthusiastic with our work! Here is the C++ program I wrote to convert SWH datasets to ds2i format:
#include <algorithm>
#include <cassert>
#include <fstream>
#include <iostream>
#include <string>
#include <unordered_map>
#include <vector>

struct Dataset
{
    std::string name;
    size_t nb_nodes;
    size_t nb_edges;
};

std::vector<Dataset> datasets = {
    {"release_to_obj", 16222788, 9907464},
    {"origin_to_snapshot", 112564374, 194970670},
    {"dir_to_rev", 35399184, 481829426},
    {"snapshot_to_obj", 170999796, 831089515},
    {"rev_to_rev", 1117498391, 1165813689},
    {"rev_to_dir", 2047888941, 1125083793}
};

void write_int_to_bin_file(std::ofstream &bin_file, uint32_t n)
{
    bin_file.write(reinterpret_cast<const char *>(&n), sizeof(n));
}

void convert_dataset(
    std::string dataset_name, std::string graph_dir, std::string output_dir)
{
    auto dataset =
        std::find_if(datasets.begin(), datasets.end(),
            [&dataset_name]
            (const Dataset &d) -> bool { return d.name == dataset_name; });
    if (dataset == datasets.end())
    {
        std::cout << "Could not find dataset: " << dataset_name << "\n";
        return;
    }

    std::unordered_map<std::string, uint32_t> node_ids;
    std::unordered_map<uint32_t, uint32_t> degrees;
    node_ids.reserve(dataset->nb_nodes);
    degrees.reserve(dataset->nb_nodes);

    // Read graph nodes
    {
        std::ifstream graph (graph_dir + dataset->name + ".nodes");
        std::string node;
        size_t node_cnt = 0;
        while (std::getline(graph, node))
        {
            node_ids[node] = node_cnt;
            node_cnt++;
        }

        std::cout << "Read " << node_cnt << " nodes.\n";
        assert(node_cnt == dataset->nb_nodes);
    }

    // A binary sequence is a sequence of integers prefixed by its length, where
    // both the sequence integers and the length are written as 32-bit
    // little-endian unsigned integers.

    // .docs output
    {
        std::string file_path = output_dir + dataset->name + ".docs";
        std::ofstream docs (file_path, std::ios::out | std::ios::binary);

        uint32_t seq_length = 1;
        uint32_t seq_nb_nodes = 2 * dataset->nb_nodes;
        write_int_to_bin_file(docs, seq_length);
        write_int_to_bin_file(docs, seq_nb_nodes);

        std::ifstream graph (graph_dir + dataset->name + ".edges");
        std::string node1, node2;
        size_t edge_cnt = 0;
        while ( std::getline(graph, node1, ' ') &&
                std::getline(graph, node2))
        {
            edge_cnt++;

            // Transform graph into a bipartite one
            uint32_t seq_node1_id = node_ids[node1];
            uint32_t seq_node2_id = node_ids[node2];
            uint32_t seq_node1bis_id = seq_node1_id + dataset->nb_nodes;
            uint32_t seq_node2bis_id = seq_node2_id + dataset->nb_nodes;

            degrees[seq_node1_id]++;
            degrees[seq_node2_id]++;

            uint32_t seq_length = 2;
            write_int_to_bin_file(docs, seq_length);
            write_int_to_bin_file(docs, seq_node1_id);
            write_int_to_bin_file(docs, seq_node2bis_id);

            write_int_to_bin_file(docs, seq_length);
            write_int_to_bin_file(docs, seq_node2_id);
            write_int_to_bin_file(docs, seq_node1bis_id);
        }

        std::cout << "Read " << edge_cnt << " edges.\n";
        assert(edge_cnt == dataset->nb_edges);
    }

    // .freq output
    {
        std::string file_path = output_dir + dataset->name + ".freqs";
        std::ofstream freqs (file_path, std::ios::out | std::ios::binary);

        for (size_t i = 0; i < 2 * dataset->nb_edges; i++)
        {
            uint32_t seq_length = 2;
            uint32_t seq_freq_node1 = 1;
            uint32_t seq_freq_node2 = 1;

            write_int_to_bin_file(freqs, seq_length);
            write_int_to_bin_file(freqs, seq_freq_node1);
            write_int_to_bin_file(freqs, seq_freq_node2);
        }
    }

    // .sizes output
    {
        std::string file_path = output_dir + dataset->name + ".sizes";
        std::ofstream sizes (file_path, std::ios::out | std::ios::binary);

        uint32_t seq_length = 2 * dataset->nb_nodes;
        write_int_to_bin_file(sizes, seq_length);
        for (size_t i = 0; i < dataset->nb_nodes; i++)
            write_int_to_bin_file(sizes, degrees[i]);
        for (size_t i = 0; i < dataset->nb_nodes; i++)
            write_int_to_bin_file(sizes, degrees[i]);
    }
}

int main(int argc, char *argv[])
{
    if (argc != 4)
    {
        std::cout << "Usage: swh_to_ds2i dataset_name graph_dir output_dir\n";
        return 0;
    }

    std::string dataset_name = argv[1];
    std::string graph_dir = argv[2];
    if (graph_dir.back() != '/')
        graph_dir += '/';
    std::string output_dir = argv[3];
    if (output_dir.back() != '/')
        output_dir += '/';

    convert_dataset(dataset_name, graph_dir, output_dir);

    return 0;
}
Once all the small datasets were converted to the ds2i format, I wrote a Bash script to automate the compression process and compute statistics:
#!/bin/bash

DATASET=$1

OUTPUT_DIR=output/$DATASET
DATASET_DIR=~/haltode/data/results/graph
PISA_PREFIX=ecir19-bisection/external/pisa/build/bin/

DS2I_IDX_DIR=$OUTPUT_DIR/original_ds2i

mkdir -p $OUTPUT_DIR

convert_to_ds2i() {
    echo "[Convert to ds2i]"
    mkdir -p $DS2I_IDX_DIR
    ./swh_to_ds2i $DATASET $DATASET_DIR $DS2I_IDX_DIR
    echo ""
}

compute_random_index() {
    echo "[Random index]"
    RANDOM_IDX_DIR=$OUTPUT_DIR/random_ds2i
    mkdir -p $RANDOM_IDX_DIR
    ./$PISA_PREFIX/shuffle_docids $DS2I_IDX_DIR/$DATASET $RANDOM_IDX_DIR/swh
    echo ""
}

compute_minhash_index() {
    echo "[Minhash index]"
    MINHASH_IDX_DIR=$OUTPUT_DIR/minhash_ds2i
    mkdir -p $MINHASH_IDX_DIR
    ./ecir19-bisection/tools/minhash/minhash $DS2I_IDX_DIR/$DATASET > $MINHASH_IDX_DIR/minhash.ordering
    ./$PISA_PREFIX/shuffle_docids $DS2I_IDX_DIR/$DATASET $MINHASH_IDX_DIR/swh $MINHASH_IDX_DIR/minhash.ordering
    echo ""
}

compute_bisec_index() {
    echo "[Graph bisection index]"
    BISEC_IDX_DIR=$OUTPUT_DIR/bisec_ds2i
    mkdir -p $BISEC_IDX_DIR
    ./$PISA_PREFIX/recursive_graph_bisection -c $DS2I_IDX_DIR/$DATASET -o $BISEC_IDX_DIR/swh --store-fwdidx $BISEC_IDX_DIR/swh.forward-index -m 4096
    echo ""
}

compute_stats() {
    echo "[Stats]"
    STATS_DIR=$OUTPUT_DIR/stats
    mkdir -p $STATS_DIR
    for idx in random minhash bisec; do
        for codec in opt block_interpolative block_streamvbyte; do
            ./$PISA_PREFIX/create_freq_index -o /dev/null -t $codec -c $OUTPUT_DIR/"$idx"_ds2i/swh &> $STATS_DIR/$idx.$codec.log
        done
        ./$PISA_PREFIX/evaluate_collection_ordering $OUTPUT_DIR/"$idx"_ds2i/swh &> $STATS_DIR/$idx.log_gap
    done
    echo ""
}

convert_to_ds2i
compute_random_index
compute_minhash_index
compute_bisec_index
compute_stats
The process ran fine with release_to_obj dataset, but got SIGKILL when running on larger datasets (dir_to_rev and origin_to_snapshot). After talking with the author directly, it seems like there is indeed a big memory overhead. Furthermore the reproducibility study focused entirely on inverted indexes and not graphs, and compression ratios on sparse graphs were not great compared to WebGraph.
In the end, the WebGraph framework seems to be the way to go: very mature and complete implementation with great compression ratio and timings. I will still run experiments with other algorithms in the background (Ligra+, graph bisection), until any final decision on the implementation is taken.